1 Drawing a TikZ picture in Emacs Org Mode
|
|
The generated figure is shown as:
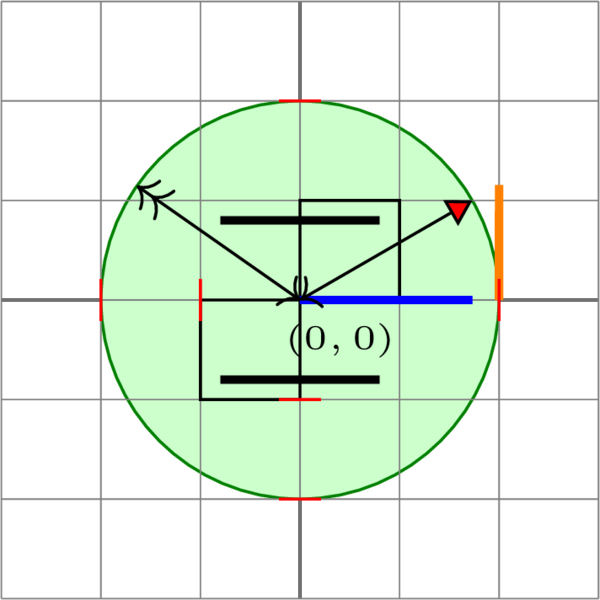
- In the minimum working example line 12 , a path is named without drawing it.
- Line 16 gives an example of using library
intersections. Note that you need to add the library using\usetikzlibrary{intersections}otherwise an error occurs during \LaTeX compiling. - Line 18 and 19 gives an example of using arrow. To make it work,
\usetikzlibrary{arrows.meta}is needed. The libraryarrows.metaprovides tons of types of arrows whick shock me when I see them the first time. - Line 21 to 24 gives an example of
scope. In the environment, all the lines are drawn in thevery thickstyle. - Line 26 to 29 gives an examplt of
foreach.foreachis handy when you want to draw a list of objects. In the minimum working example , I draw a list of short red sticks along with the x-axis and y-axis. - Line 31 is an example of
node. The keywordnodeis typically followed by some options between[]and then some text between{}. Every node has flexible anchor options to decide where the text should be placed.
2 Another Example
The code is shown as:
|
|
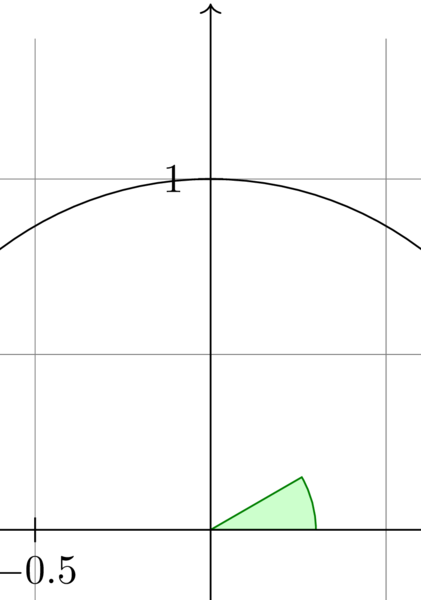
The generated figure is shown as:
3 Some Basic Rules in TikZ
The options appear in
[]. No matter it is an object or an operation, the contents in the following[]serve as options.Options
[]can be at the very beginning of the environmenttikzpicturefollowing the operation, following the object.\filldrawis a good command. It draws a closed loop and fill it with color or pattern. The colors for filling and drawing can be different.Coordinates can be specified in x-y format, polar format.
- The easiest way is
(x,y)which meansxcm in the x-axis andycm in the y-axis; (a:x)is the polar format which meansxcm in directionadegree.
- The easiest way is
(<p> |- <q>)is another way to specify coordinates for example(30:1 |- 0,0)which means the interaction of a vertical line through(30:1)and a horizontal line through(0,0).Relative coordinates are possible with
+and++in front of(x,y)and(a:x).+is relative to the closest coordinate whereas++is relative to the very first coordinate of current path.
4 Some tips for in TikZ
- To use
intersectionsto specify a coordinate, you need to include the library, i.e.\usetikzlibrary{intersections}is a must.
|
|
<~/Dropbox/research_library/zcl.bib>
MSC
Make STEAM Clear
I post articles and make videos about STEAM and try to explain the concepts in a more approachable and beautiful way.